应用化学 ›› 2025, Vol. 42 ›› Issue (6): 838-849.DOI: 10.19894/j.issn.1000-0518.240429
范郑欣, 昝佳君, 杜园, 孙通( )
)
收稿日期:2024-12-26
接受日期:2025-05-11
出版日期:2025-06-01
发布日期:2025-07-01
通讯作者:
孙通
基金资助:
Zheng-Xin FAN, Jia-Jun ZAN, Yuan DU, Tong SUN()
Received:2024-12-26
Accepted:2025-05-11
Published:2025-06-01
Online:2025-07-01
Contact:
Tong SUN
About author:suntong980@163.comSupported by:摘要:
快速无损鉴别香榧陈籽和新籽,对保护消费者权益十分重要。 采用可见光-近红外光谱仪(光谱仪Ⅰ)、近红外中短波光谱仪(光谱仪Ⅱ)采集带壳香榧样本的光谱,使用9种方法对光谱数据进行预处理,然后利用区间优化选择算法(ICO)、竞争自适应重加权采样(CARS)、连续投影算法(SPA)和变量组合种群分析(VCPA)选择方法筛选显著相关的光谱特征变量,基于优化后的特征变量,分别应用线性判别分析(LDA)、支持向量机(SVM)和反向传播神经网络(BP)方法建立香榧陈籽的判别模型。 结果表明,通过光谱特征优化与模型适配,对于可见-近红外光谱,CARS-SVM模型性能较优,其预测集的敏感性、特异性和准确率均为100%; 对于近红外中短波光谱,标准正态变量变换(SNV)预处理联合VCPA优化特征变量构建的BP模型较优,其预测集敏感性、特异性和准确率分别为98.18%、93.02%和95.04%。 由此可知,近红外光谱结合化学计量学方法能较好地实现香榧陈籽的判别。 旨为香榧陈籽快速无损判别提供一种新的检测方法,有效区分香榧的品质。
中图分类号:
范郑欣, 昝佳君, 杜园, 孙通. 基于近红外光谱结合机器算法的新陈香榧籽无损鉴别[J]. 应用化学, 2025, 42(6): 838-849.
Zheng-Xin FAN, Jia-Jun ZAN, Yuan DU, Tong SUN. Rapid and Non-Destructive Identification of New Torreya grandis Seeds Based on Near-Infrared Spectroscopy and Feature Wavelength Selection Combined with Machine Algorithm for Discrimination[J]. Chinese Journal of Applied Chemistry, 2025, 42(6): 838-849.
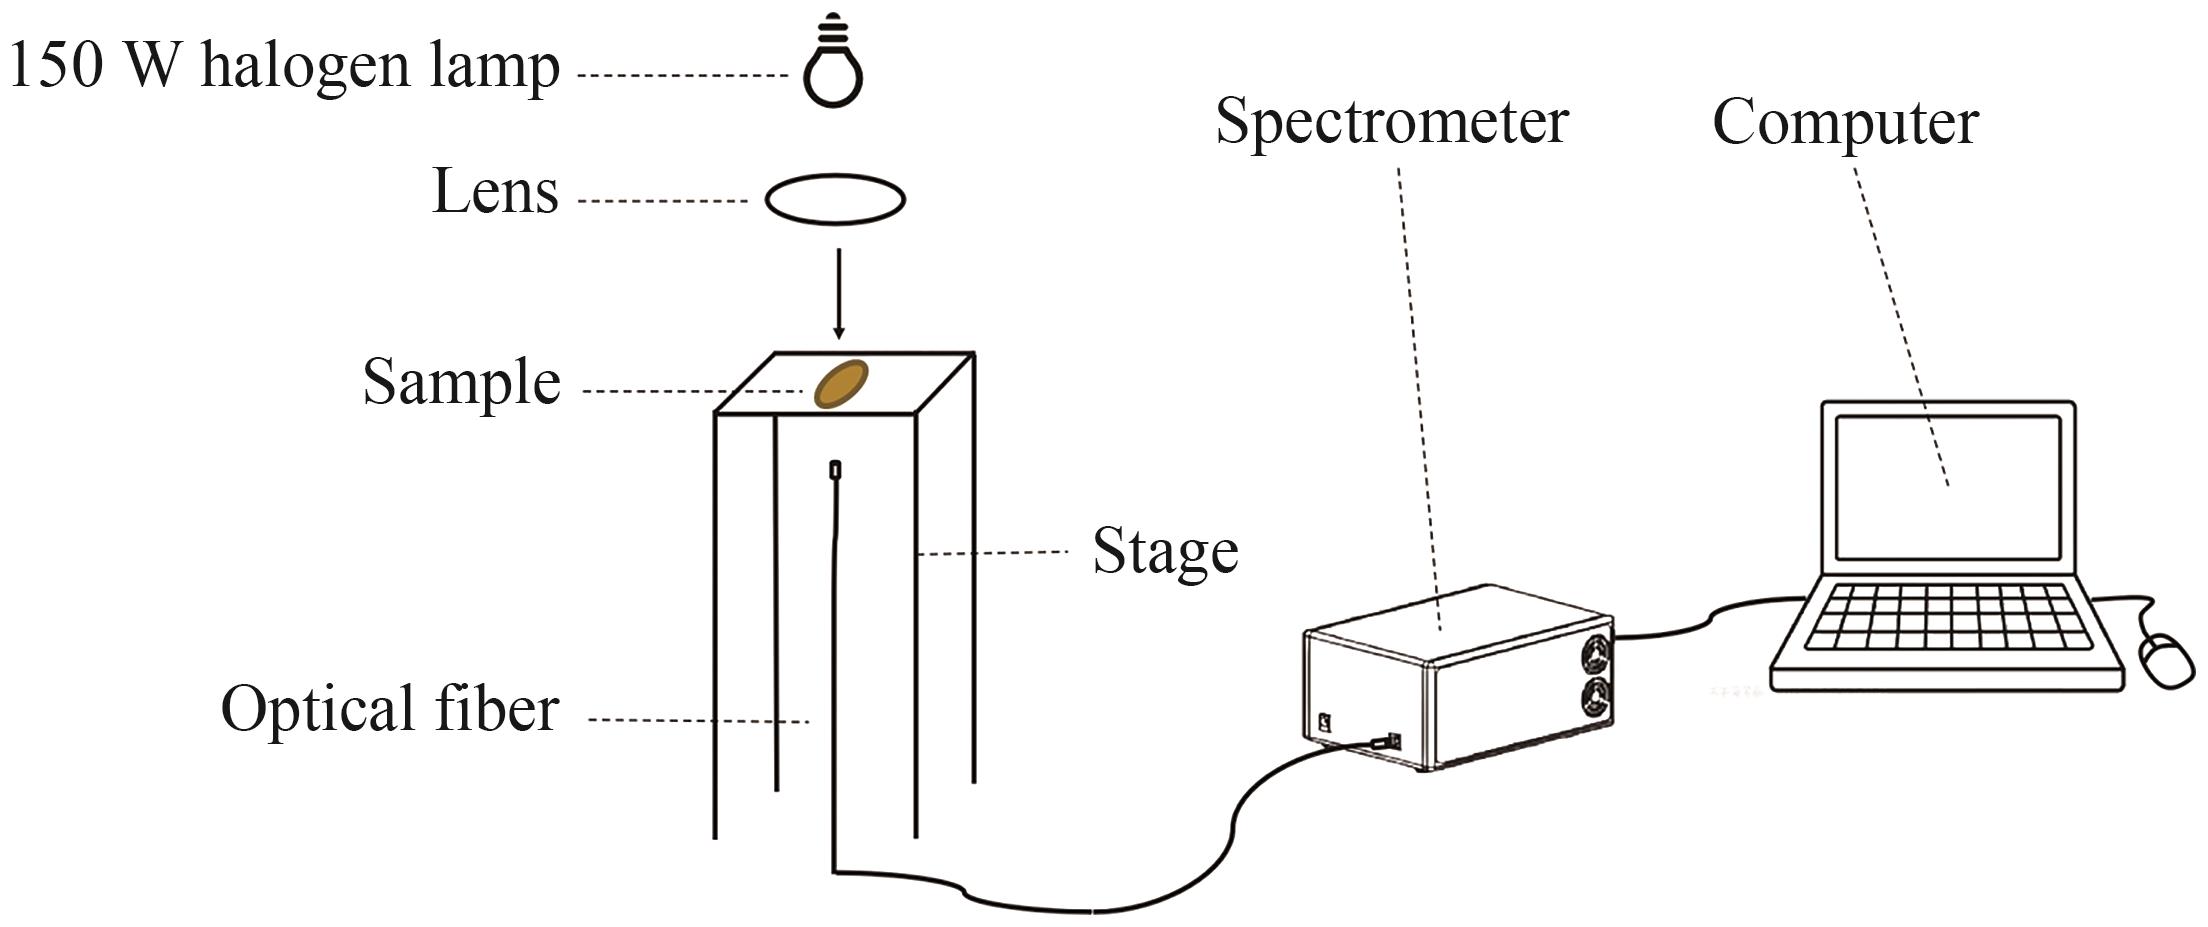
图1 香榧籽近红外透射检测装置
Fig.1 Near infrared transmission detection device of Torreya grandis seeds
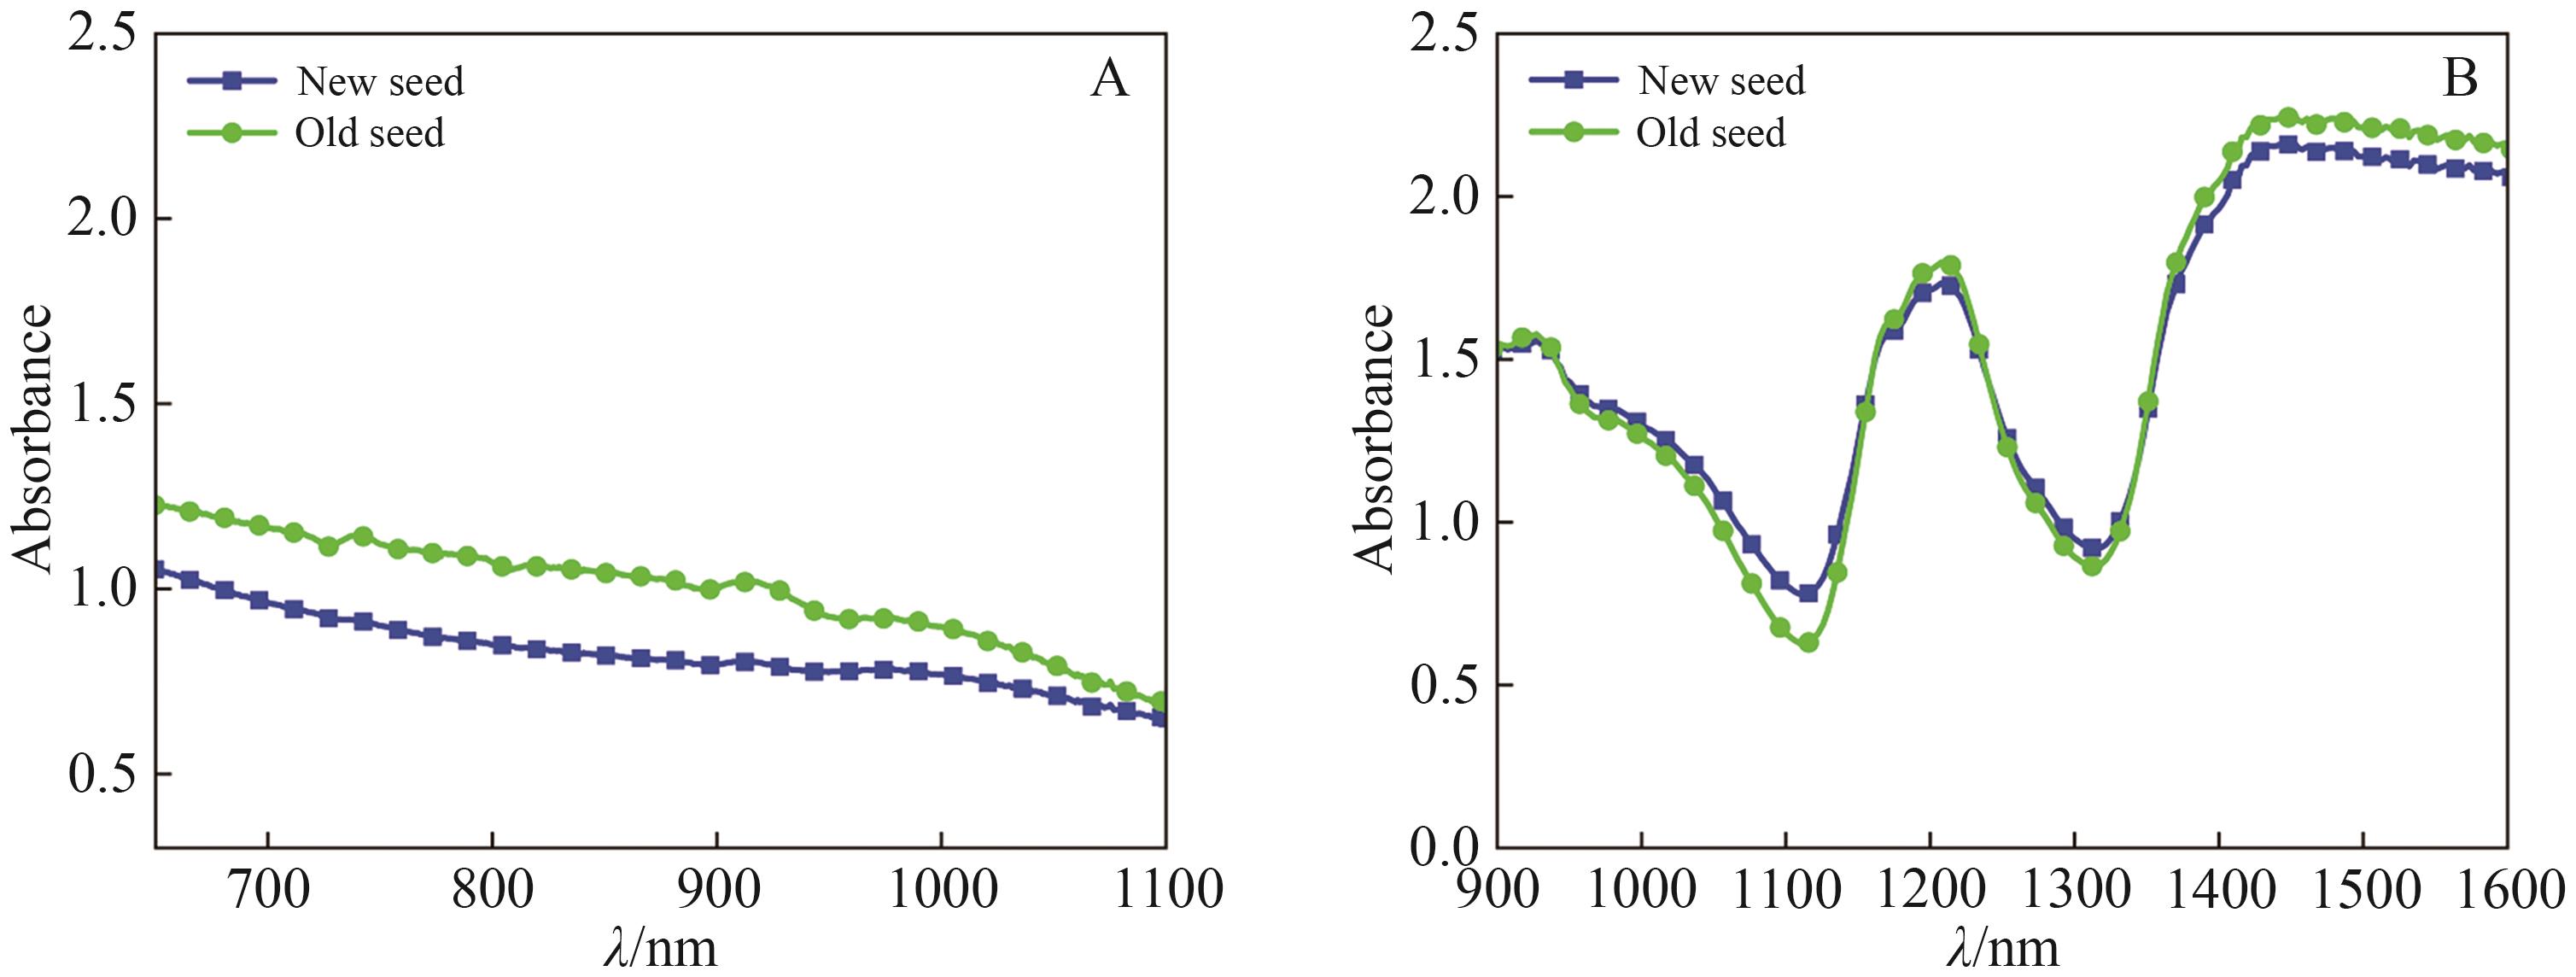
图2 光谱仪Ⅰ(A)和光谱仪Ⅱ(B)采集的香榧新陈籽平均近红外光谱
Fig.2 Average near-infrared spectra of fresh and stale Torreya grandis seeds collected by spectrometer Ⅰ (A) and spectrometer Ⅱ (B)
| Principal component | Spectrometer Ⅰ | Spectrometer Ⅱ | ||
|---|---|---|---|---|
| Variance contribution rate/% | Cumulative contribution rate/% | Variance contribution rate/% | Cumulative contribution rate/% | |
| 1 | 84.44 | 84.44 | 79.21 | 79.21 |
| 2 | 14.44 | 98.89 | 15.12 | 94.33 |
| 3 | 0.84 | 99.73 | 3.92 | 98.25 |
| 4 | 0.21 | 99.94 | 1.09 | 99.34 |
表1 香榧籽光谱的主成分贡献率
Table 1 Principal component contribution of Torreya grandis seeds spectra
| Principal component | Spectrometer Ⅰ | Spectrometer Ⅱ | ||
|---|---|---|---|---|
| Variance contribution rate/% | Cumulative contribution rate/% | Variance contribution rate/% | Cumulative contribution rate/% | |
| 1 | 84.44 | 84.44 | 79.21 | 79.21 |
| 2 | 14.44 | 98.89 | 15.12 | 94.33 |
| 3 | 0.84 | 99.73 | 3.92 | 98.25 |
| 4 | 0.21 | 99.94 | 1.09 | 99.34 |
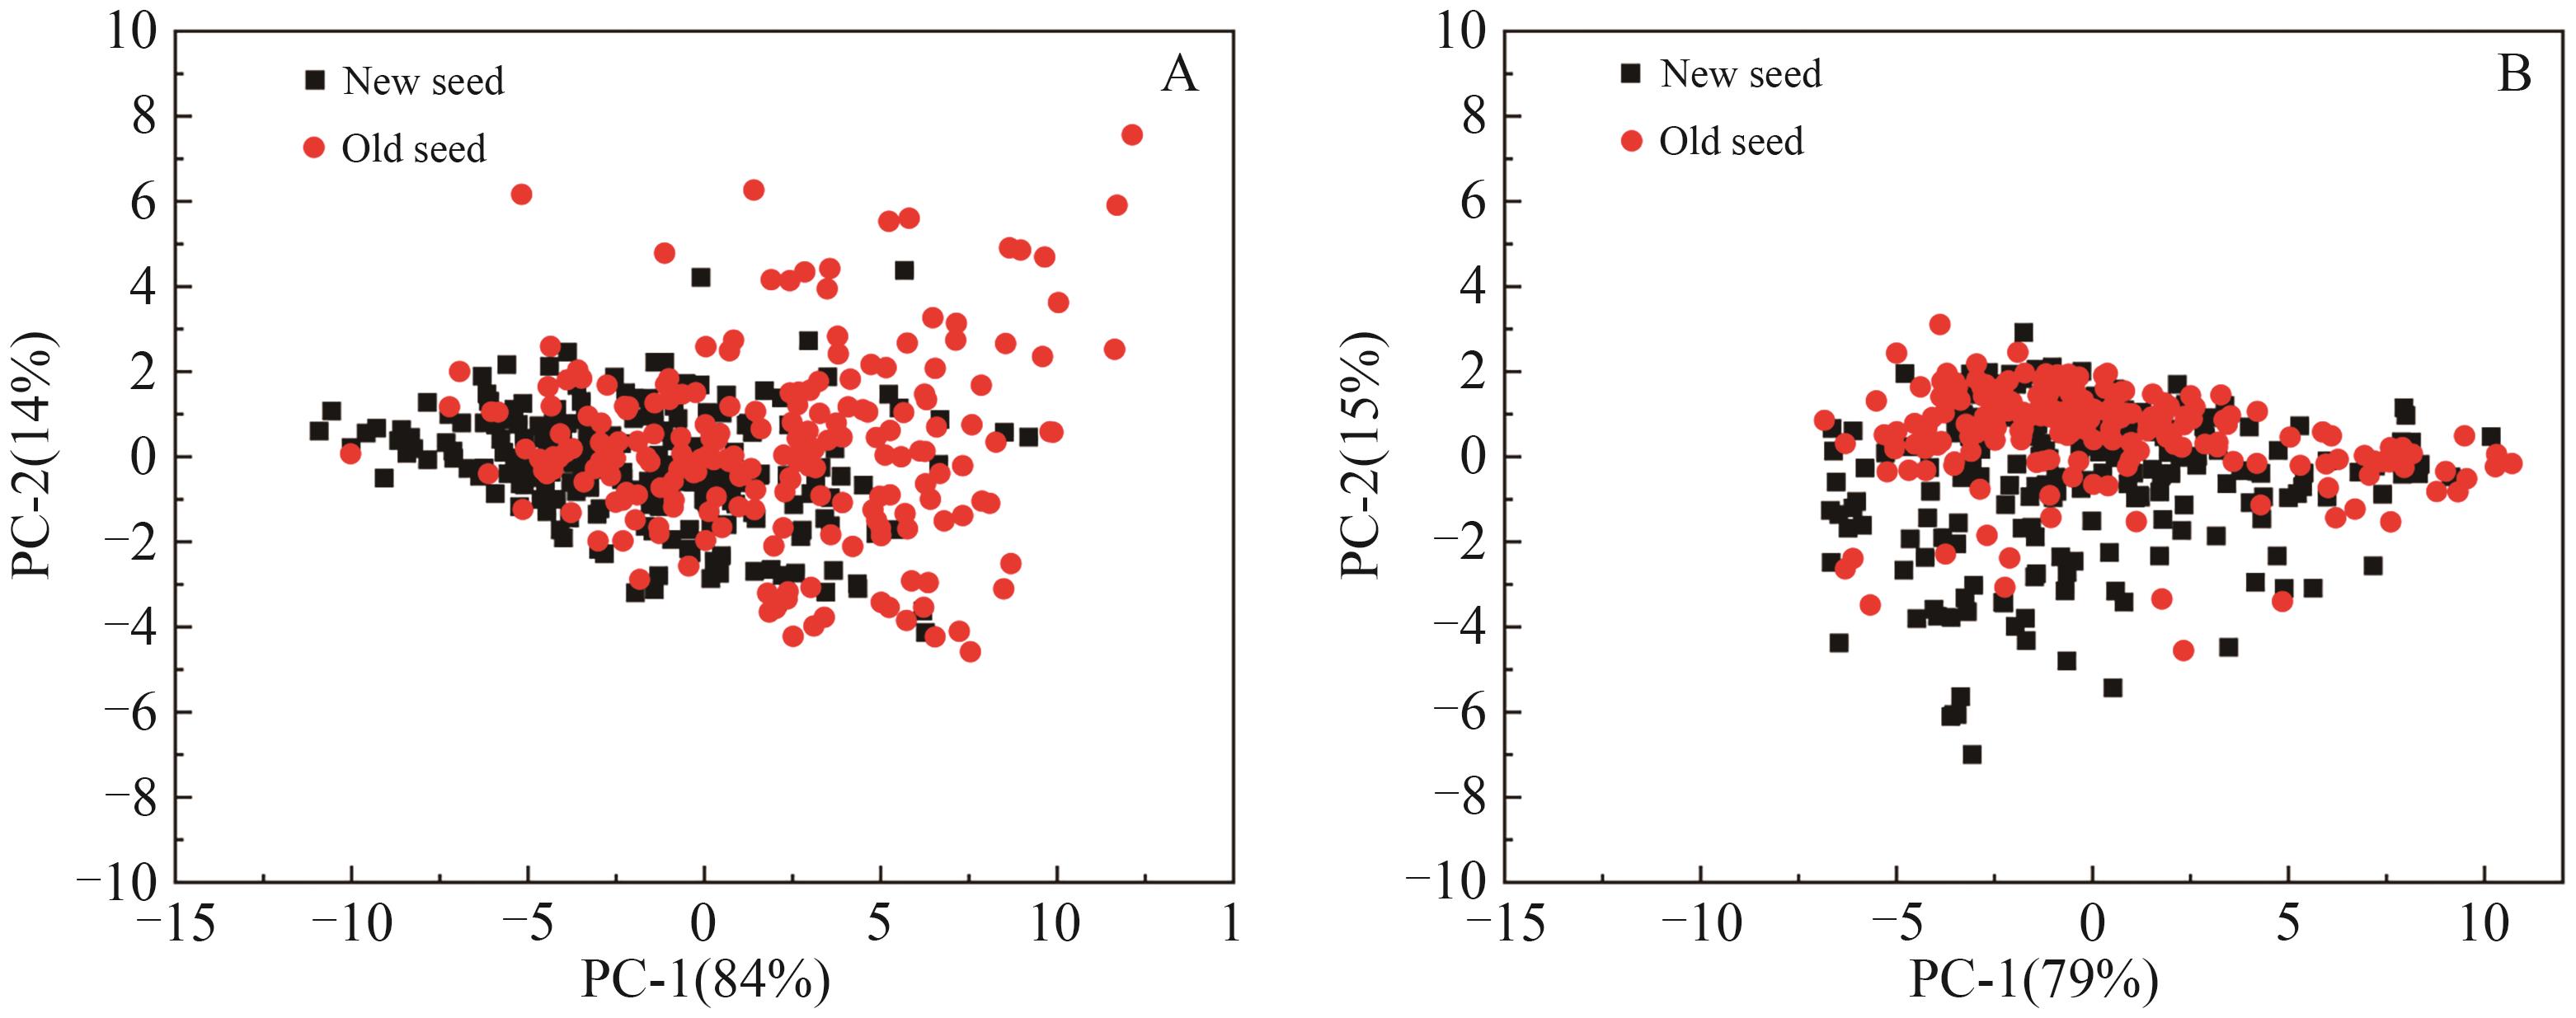
图3 第1和第2主成分散点分布图A. Spectrometer Ⅰ; B. Spectrometer Ⅱ
Fig.3 Distribution of the first and second principal components
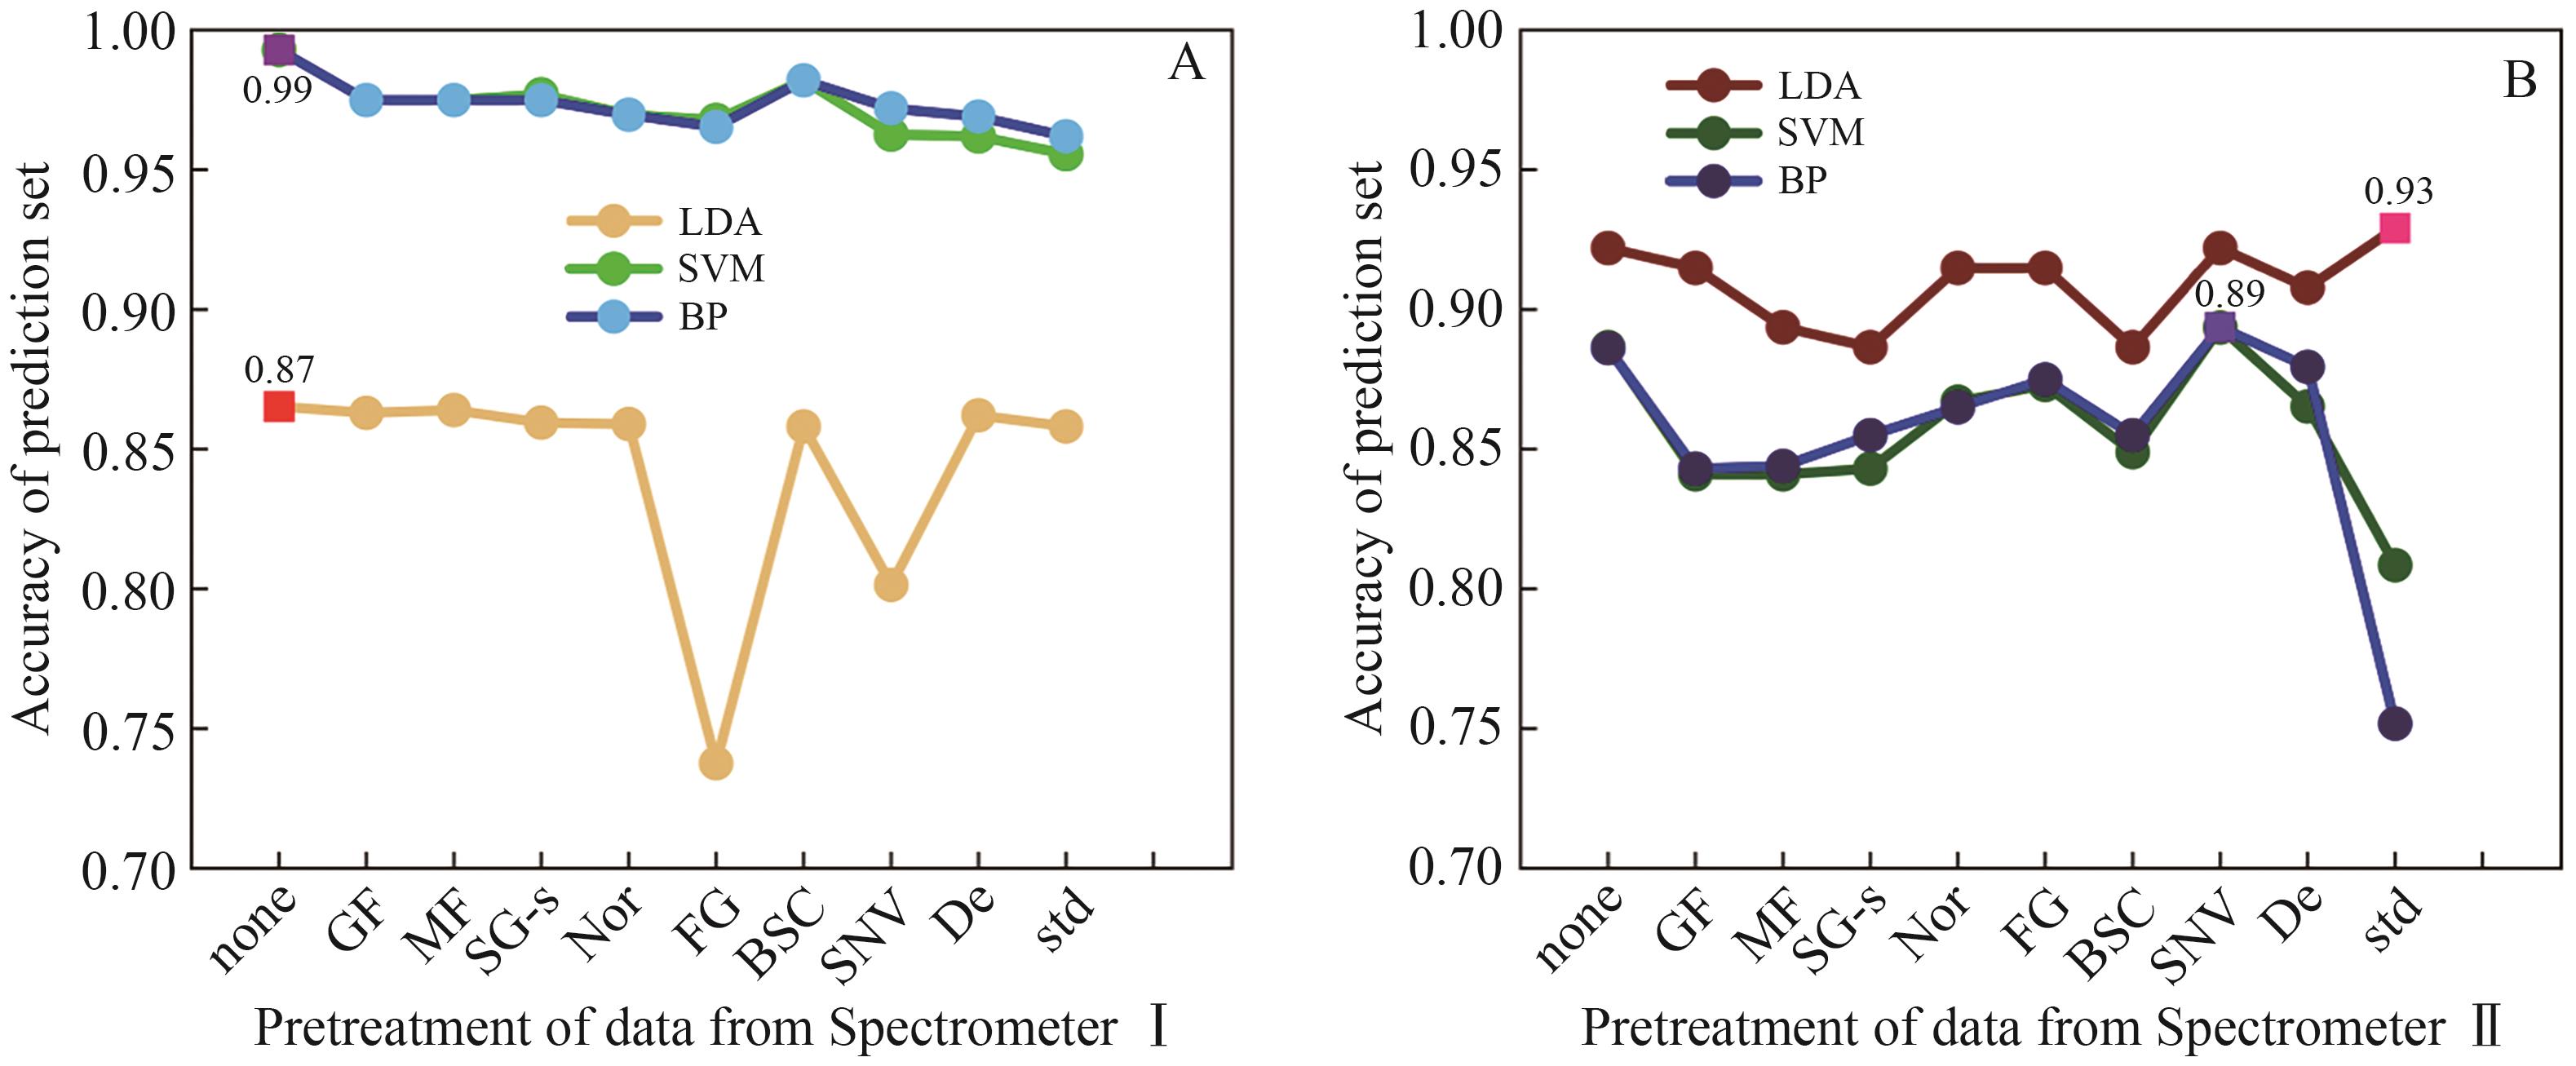
图4 光谱仪Ⅰ(A)和光谱仪Ⅱ(B)在不同预处理下香榧陈籽判别模型的预测集准确率
Fig.4 Accuracy of discriminative models for stale Torreya grandis seeds under different preprocessing methods of (A) spectrometer Ⅰ and (B) spectrometer Ⅱ
| Data set | Spectral preprocessing | Modeling methods | Calibration set | Prediction set | ||||
|---|---|---|---|---|---|---|---|---|
| Sensitivity/% | Specificity/% | Accuracy/% | Sensitivity/% | Specificity/% | Accuracy/% | |||
| Spectrometer Ⅰ | None | LDA | 99.34 | 97.67 | 98.58 | 73.13 | 98.67 | 86.62 |
| None | SVM | 99.22 | 98.69 | 98.93 | 100.00 | 98.25 | 99.29 | |
| None | BP | 98.44 | 98.04 | 98.22 | 100.00 | 98.25 | 99.29 | |
| Spectrometer Ⅱ | Standard | LDA | 92.31 | 91.89 | 92.09 | 90.12 | 96.67 | 92.91 |
| SNV | SVM | 89.12 | 87.02 | 88.13 | 89.29 | 88.24 | 88.65 | |
| SNV | BP | 88.36 | 85.61 | 87.05 | 90.91 | 88.37 | 89.36 | |
表2 最优预处理方法下香榧陈籽的判别模型结果
Table 2 Discriminative modelling results of stale Torreya grandis seeds under the optimal preprocessing method
| Data set | Spectral preprocessing | Modeling methods | Calibration set | Prediction set | ||||
|---|---|---|---|---|---|---|---|---|
| Sensitivity/% | Specificity/% | Accuracy/% | Sensitivity/% | Specificity/% | Accuracy/% | |||
| Spectrometer Ⅰ | None | LDA | 99.34 | 97.67 | 98.58 | 73.13 | 98.67 | 86.62 |
| None | SVM | 99.22 | 98.69 | 98.93 | 100.00 | 98.25 | 99.29 | |
| None | BP | 98.44 | 98.04 | 98.22 | 100.00 | 98.25 | 99.29 | |
| Spectrometer Ⅱ | Standard | LDA | 92.31 | 91.89 | 92.09 | 90.12 | 96.67 | 92.91 |
| SNV | SVM | 89.12 | 87.02 | 88.13 | 89.29 | 88.24 | 88.65 | |
| SNV | BP | 88.36 | 85.61 | 87.05 | 90.91 | 88.37 | 89.36 | |
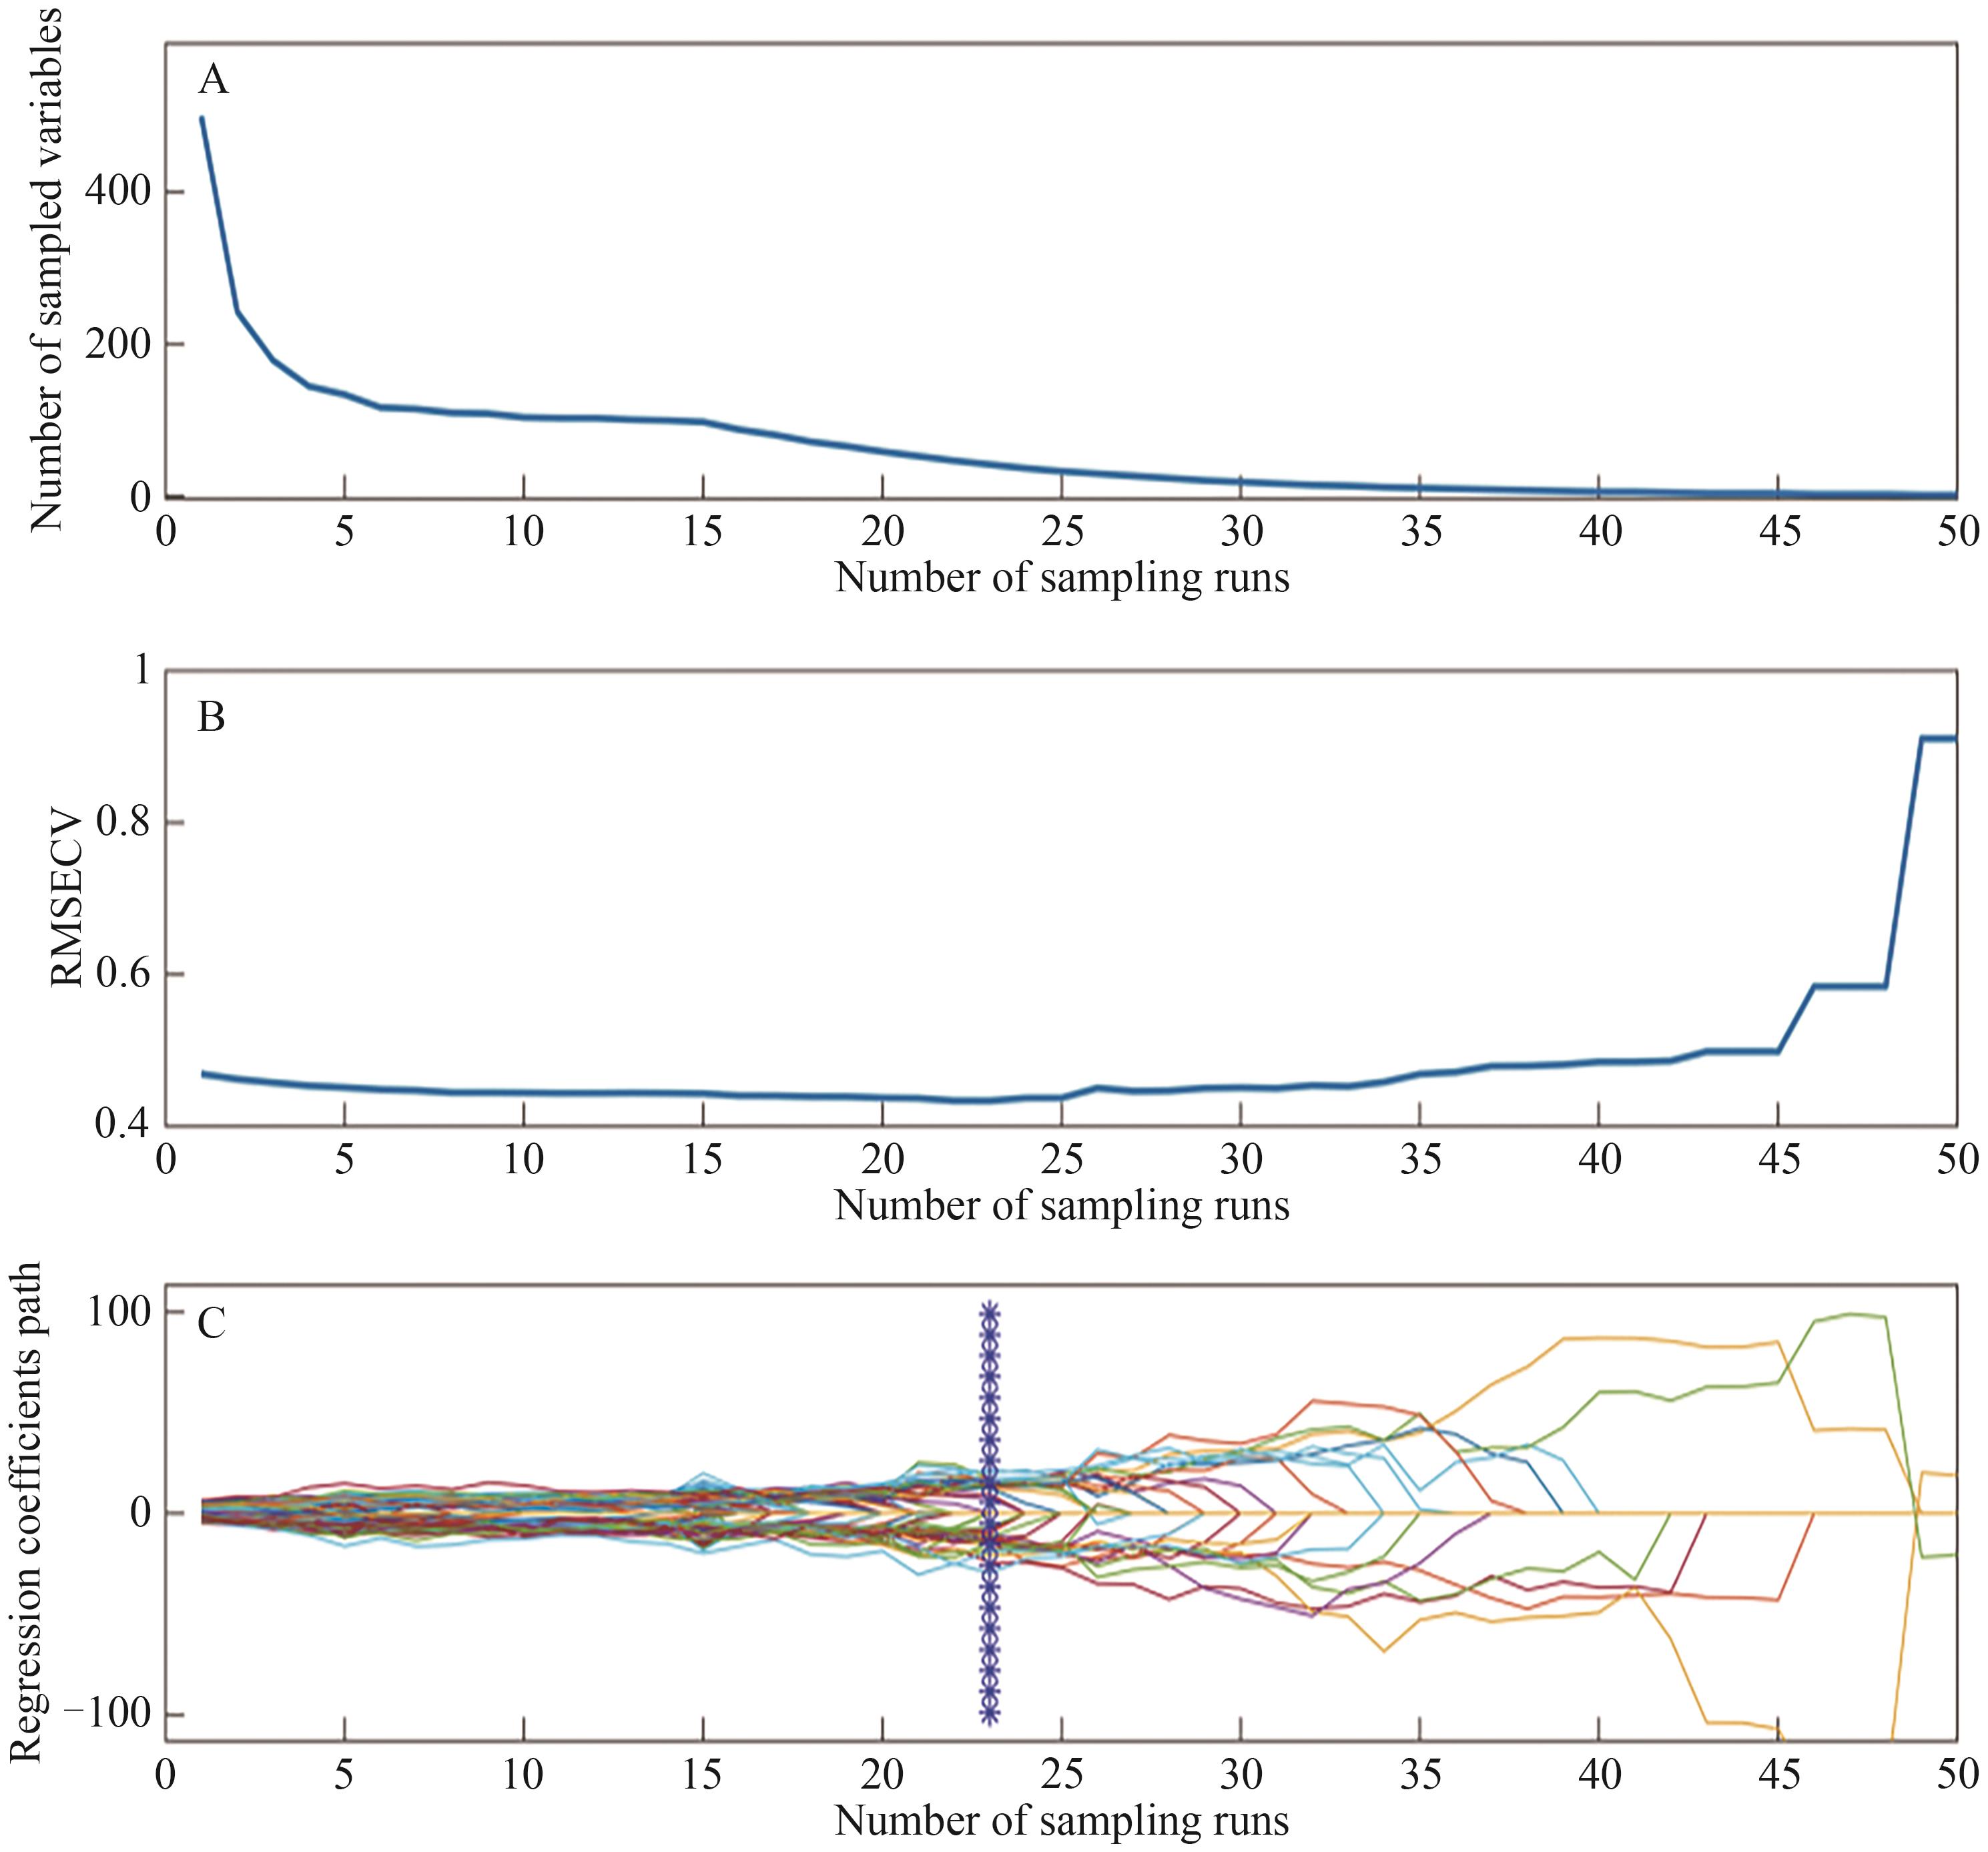
图5 光谱仪Ⅰ香榧陈籽的CARS变量选择结果A. Number of selected variables; B. RMSECV; C. Regression coefficient path
Fig.5 CARS variable selection results of stale Torreya grandis seeds in spectrometer Ⅰ
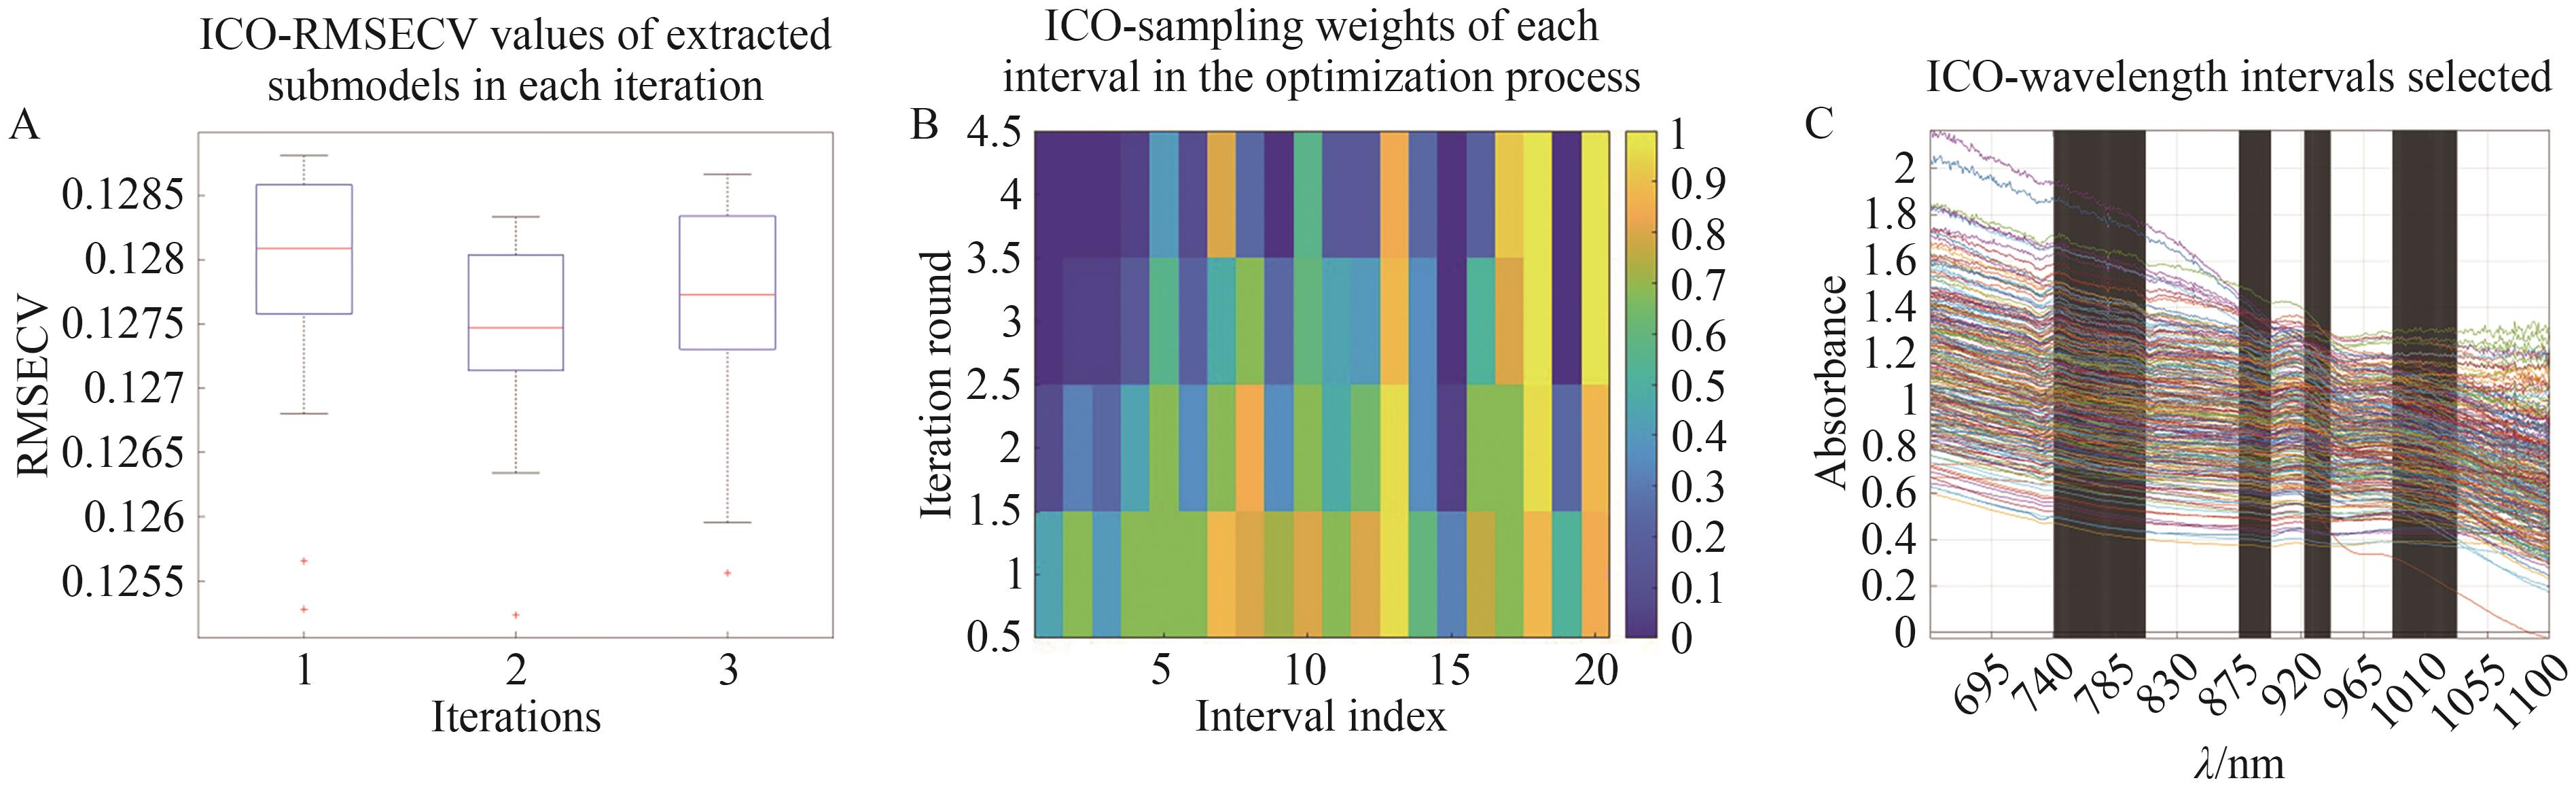
图6 光谱仪Ⅰ香榧陈籽的ICO变量选择结果
Fig.6 ICO variable selection results of stale Torreya grandis seeds in spectrometer Ⅰ
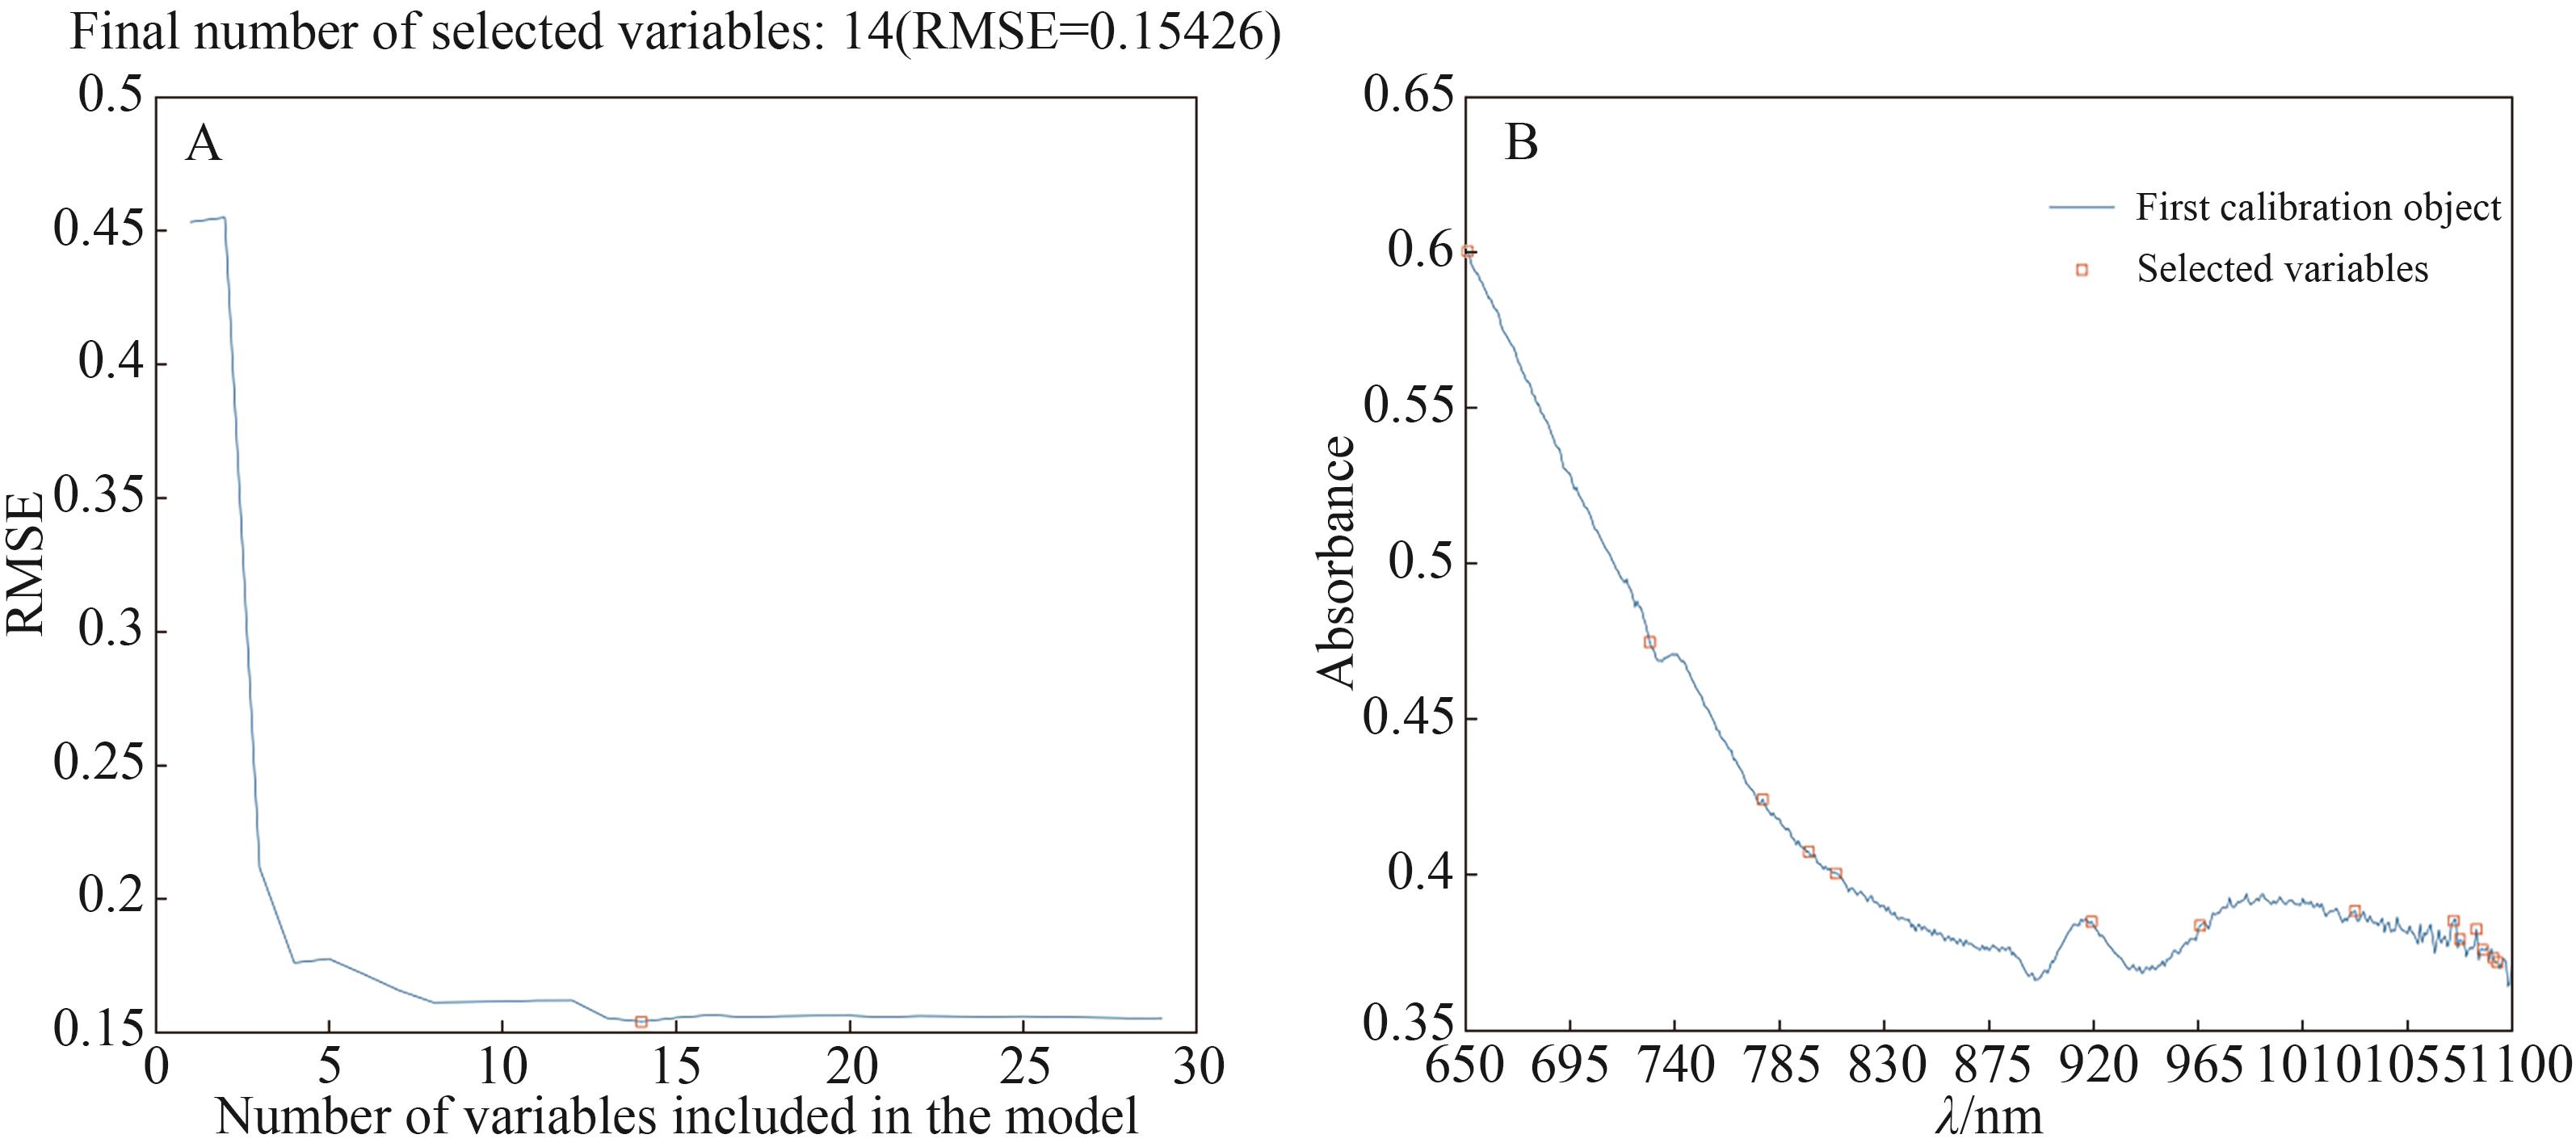
图7 光谱仪Ⅰ对香榧陈籽的SPA变量选择结果
Fig.7 SPA variable selection results of stale Torreya grandis seeds in spectrometer Ⅰ
图8 VCPA均方根误差图
Fig.8 VCPA root mean square error plot
| Wavelength selection methods | Modeling methods | Number of variables | Preprocessing | Calibration set | Prediction set | ||||
|---|---|---|---|---|---|---|---|---|---|
| Sensitivity/% | Specificity/% | Accuracy/% | Sensitivity/% | Specificity/% | Accuracy/% | ||||
| CARS | LDA | 30 | None | 100.00 | 99.22 | 99.64 | 75.68 | 100.00 | 87.23 |
| SVM | 30 | None | 100.00 | 100.00 | 100.00 | 100.00 | 100.00 | 100.00 | |
| BP | 30 | None | 100.00 | 100.00 | 100.00 | 100.00 | 98.25 | 99.29 | |
| ICO | LDA | 172 | None | 100.00 | 100.00 | 100.00 | 75.68 | 98.51 | 86.52 |
| SVM | 172 | None | 100.00 | 99.35 | 99.64 | 100.00 | 98.25 | 99.29 | |
| BP | 172 | None | 100.00 | 99.35 | 99.64 | 100.00 | 98.25 | 99.29 | |
| SPA | LDA | 14 | None | 99.34 | 99.22 | 99.29 | 75.68 | 98.51 | 86.52 |
| SVM | 14 | None | 99.22 | 99.34 | 99.29 | 100.00 | 98.25 | 99.29 | |
| BP | 14 | None | 96.85 | 96.10 | 96.44 | 97.65 | 96.43 | 97.16 | |
| VCPA | LDA | 14 | None | 100.00 | 99.22 | 99.64 | 75.68 | 98.51 | 86.52 |
| SVM | 14 | None | 100.00 | 99.35 | 99.64 | 100.00 | 98.25 | 99.29 | |
| BP | 14 | None | 100.00 | 100.00 | 100.00 | 98.82 | 98.21 | 98.58 | |
表3 基于特征波长的香榧陈籽的判别模型结果(光谱仪Ⅰ)
Table 3 Discriminative model results of stale Torreya grandis seeds based on characteristic wavelengths (spectrometer Ⅰ)
| Wavelength selection methods | Modeling methods | Number of variables | Preprocessing | Calibration set | Prediction set | ||||
|---|---|---|---|---|---|---|---|---|---|
| Sensitivity/% | Specificity/% | Accuracy/% | Sensitivity/% | Specificity/% | Accuracy/% | ||||
| CARS | LDA | 30 | None | 100.00 | 99.22 | 99.64 | 75.68 | 100.00 | 87.23 |
| SVM | 30 | None | 100.00 | 100.00 | 100.00 | 100.00 | 100.00 | 100.00 | |
| BP | 30 | None | 100.00 | 100.00 | 100.00 | 100.00 | 98.25 | 99.29 | |
| ICO | LDA | 172 | None | 100.00 | 100.00 | 100.00 | 75.68 | 98.51 | 86.52 |
| SVM | 172 | None | 100.00 | 99.35 | 99.64 | 100.00 | 98.25 | 99.29 | |
| BP | 172 | None | 100.00 | 99.35 | 99.64 | 100.00 | 98.25 | 99.29 | |
| SPA | LDA | 14 | None | 99.34 | 99.22 | 99.29 | 75.68 | 98.51 | 86.52 |
| SVM | 14 | None | 99.22 | 99.34 | 99.29 | 100.00 | 98.25 | 99.29 | |
| BP | 14 | None | 96.85 | 96.10 | 96.44 | 97.65 | 96.43 | 97.16 | |
| VCPA | LDA | 14 | None | 100.00 | 99.22 | 99.64 | 75.68 | 98.51 | 86.52 |
| SVM | 14 | None | 100.00 | 99.35 | 99.64 | 100.00 | 98.25 | 99.29 | |
| BP | 14 | None | 100.00 | 100.00 | 100.00 | 98.82 | 98.21 | 98.58 | |
| Wavelength selection methods | Modeling methods | Number of variables | Preprocessing | Calibration set | Prediction set | ||||
|---|---|---|---|---|---|---|---|---|---|
| Sensitivity/% | Specificity/% | Accuracy/% | Sensitivity/% | Specificity/% | Accuracy/% | ||||
| CARS | LDA | 32 | Standard | 91.54 | 89.86 | 90.65 | 75.31 | 85.00 | 79.43 |
| SVM | 24 | SNV | 93.20 | 91.60 | 92.45 | 92 | 95.00 | 93.62 | |
| BP | 24 | SNV | 86.00 | 85.16 | 85.61 | 90.74 | 87.36 | 88.65 | |
| ICO | LDA | 119 | Standard | 90.00 | 91.89 | 91.01 | 81.48 | 81.67 | 81.56 |
| SVM | 75 | SNV | 84.87 | 84.92 | 84.89 | 87.27 | 86.05 | 86.52 | |
| BP | 75 | None | 80.00 | 85.84 | 82.37 | 79.37 | 87.18 | 83.69 | |
| SPA | LDA | 12 | Standard | 74.62 | 80.41 | 77.70 | 70.37 | 68.33 | 69.50 |
| SVM | 17 | SNV | 91.97 | 84.40 | 88.13 | 92.31 | 86.52 | 88.65 | |
| BP | 17 | SNV | 89.33 | 89.06 | 89.21 | 88.14 | 90.24 | 89.36 | |
| VCPA | LDA | 10 | Standard | 88.46 | 88.51 | 88.49 | 82.72 | 83.33 | 82.98 |
| SVM | 12 | SNV | 92.81 | 95.20 | 93.88 | 96.43 | 92.94 | 94.33 | |
| BP | 12 | SNV | 97.92 | 94.78 | 96.40 | 98.18 | 93.02 | 95.04 | |
表4 基于特征波长的香榧陈籽的判别模型结果(光谱仪Ⅱ)
Table 4 Discriminative model results of stale Torreya grandis seeds based on characteristic wavelengths (spectrometer Ⅱ)
| Wavelength selection methods | Modeling methods | Number of variables | Preprocessing | Calibration set | Prediction set | ||||
|---|---|---|---|---|---|---|---|---|---|
| Sensitivity/% | Specificity/% | Accuracy/% | Sensitivity/% | Specificity/% | Accuracy/% | ||||
| CARS | LDA | 32 | Standard | 91.54 | 89.86 | 90.65 | 75.31 | 85.00 | 79.43 |
| SVM | 24 | SNV | 93.20 | 91.60 | 92.45 | 92 | 95.00 | 93.62 | |
| BP | 24 | SNV | 86.00 | 85.16 | 85.61 | 90.74 | 87.36 | 88.65 | |
| ICO | LDA | 119 | Standard | 90.00 | 91.89 | 91.01 | 81.48 | 81.67 | 81.56 |
| SVM | 75 | SNV | 84.87 | 84.92 | 84.89 | 87.27 | 86.05 | 86.52 | |
| BP | 75 | None | 80.00 | 85.84 | 82.37 | 79.37 | 87.18 | 83.69 | |
| SPA | LDA | 12 | Standard | 74.62 | 80.41 | 77.70 | 70.37 | 68.33 | 69.50 |
| SVM | 17 | SNV | 91.97 | 84.40 | 88.13 | 92.31 | 86.52 | 88.65 | |
| BP | 17 | SNV | 89.33 | 89.06 | 89.21 | 88.14 | 90.24 | 89.36 | |
| VCPA | LDA | 10 | Standard | 88.46 | 88.51 | 88.49 | 82.72 | 83.33 | 82.98 |
| SVM | 12 | SNV | 92.81 | 95.20 | 93.88 | 96.43 | 92.94 | 94.33 | |
| BP | 12 | SNV | 97.92 | 94.78 | 96.40 | 98.18 | 93.02 | 95.04 | |
| 1 | 王蕤, 王玫鹃, 汤富彬, 等. 浙江省不同地区香榧生籽营养品质差异性分析与评价[J]. 核农学报, 2021, 35(11): 2578-2588. |
| WANG R, WANG M J, TANG F B, et al. Analysis and evaluation of nutritional quality differences of Torreya grandis in different regions of Zhejiang Province[J]. J Nuclear Agric Sci, 2021, 35(11): 2578-2588. | |
| 2 | 何慈颖, 娄和强, 吴家胜. 香榧油脂及其合成调控机制研究进展[J]. 浙江农林大学学报, 2023, 40(4): 714-722. |
| HE C Y, LOU H Q, WU J S. Research progress on the oil and its synthesis regulation mechanism of Torreya grandis[J]. J Zhejiang A&F Univ, 2023, 40(4): 714-722. | |
| 3 | LI H L, XIAO N, SUN T, et al. Influence of lighting pattern and sample positioning on detection of moldy core disease in apples by NIR spectroscopy[J]. Food Bioprocess Technol, 2024, 17(12): 5221-5241. |
| 4 | CORTÉS V, BLASCO J, ALEIXOS N, et al. Monitoring strategies for quality control of agricultural products using visible and near-infrared spectroscopy: a review[J]. Trends Food Sci Technol, 2019, 85: 138-148. |
| 5 | QIAO L, MU Y C, LU B, et al. Calibration maintenance application of near-infrared spectrometric model in food analysis[J]. Food Rev Int, 2023, 39(3): 1628-1644. |
| 6 | SQUEO G, CRUZ J, DE ANGELIS D, et al. Considerations about the gap between research in near-infrared spectroscopy and official methods and recommendations of analysis in foods[J]. Curr Opin Food Sci, 2024, 59: 101203. |
| 7 | VELEZ-SILVA N L, DRENNEN J K, ANDERSON C A. Continuous manufacturing of pharmaceutical products: a density-insensitive near infrared method for the in-line monitoring of continuous powder streams[J]. Int J Pharm, 2024, 650: 123699. |
| 8 | REN S H, JIA Y F. Near-infrared data classification at phone terminal based on the combination of PCA and CS-RBFSVC algorithms[J]. Spectrochim Acta A, 2023, 287: 122080. |
| 9 | LOU Q J, LEI M, WANG Y, et al. Diagnostic features emerging in near-infrared reflectance spectroscopy for low petroleum hydrocarbon pollution after spectral subtraction[J]. SCI Total Environ, 2024, 928: 172264. |
| 10 | LIU S Y, WANG S T, HU C H, et al. apid and accurate determination of diesel multiple properties through NIR data analysis assisted by machine learning[J]. Spectrochim Acta A, 2022, 277: 121261. |
| 11 | HU J Q, MA X C, LIU L L, et al. Rapid evaluation of the quality of chestnuts using near-infrared reflectance spectroscopy[J]. Food Chem, 2017, 231: 141-147. |
| 12 | 刘洁. 基于近红外光谱技术的板栗品质无损检测方法研究[D]. 武汉: 华中农业大学, 2011. |
| LIU J. Research on nondestructive detection method of chestnut quality based on near infrared spectroscopy technology[D]. Wuhan: Huazhong Agricultural University, 2011. | |
| 13 | 张严, 谢岩黎, 孙淑敏, 等. 近红外分析花生籽粒脂肪酸含量的研究[J]. 河南工业大学学报(自然科学版), 2014, 35(2): 54-58. |
| ZHANG Y, XIE Y L, SUN S M, et al. Research on near infrared analysis of fatty acid content in Peanut Grains[J]. J Henan Univ Technol (Nat Sci Ed), 2014, 35(2): 54-58. | |
| 14 | CANNEDDU G, JÚNIOR L C, DE ALMEIDA TEIXEIRA G H. Quality evaluation of shelled and unshelled macadamia nuts by means of near-infrared spectroscopy (NIR)[J]. J Food Sci, 2016, 81(7): C1613-C1621. |
| 15 | MOSCETTI R, MONARCA D, CECCHINI M, et al. Detection of mold-damaged chestnuts by near-infrared spectroscopy[J]. Postharvest Bio Techol, 2014, 93: 83-90. |
| 16 | CARVALHO L C, MORAIS C L M, LIMA K M G, et al. Using intact nuts and near infrared spectroscopy to classify macadamia cultivars[J]. Food Anal Method, 2018, 11(7): 1857-1866. |
| 17 | GHOSH S, MISHRA P, MOHAMAD S N H, et al. Discrimination of peanuts from bulk cereals and nuts by near infrared reflectance spectroscopy[J]. Biosyst Eng, 2016, 151: 178-186. |
| 18 | HUANG T, CAI G, LIU H, et al. Selecting near-infrared reflection spectroscopy pretreatment methods by chemical components valid and invalid absorption wavebands[J]. Spectr Lett, 2022, 55(9): 607-617. |
| 19 | KONG L F, WU C Z, LI H L, et al. Discrimination of tea seed oil adulteration based on near-infrared spectroscopy and combined preprocessing method[J]. J Food Compos Anal, 2024, 134: 106560. |
| 20 | ZHANG W, PAN L, LU L. Prediction of TVB-N content in beef with packaging films using visible-near infrared hyperspectral imaging[J]. Food Control, 2023, 147: 109562. |
| 21 | LI M X, SHI Y B, ZHANG J B, et al. Rapid evaluation of Ziziphi Spinosae Semen and its adulterants based on the combination of FT-NIR and multivariate algorithms[J]. Food Chem: X, 2023, 20: 101022. |
| 22 | TANG R, CHEN X, LI C. Detection of nitrogen content in rubber leaves using near-infrared (NIR) spectroscopy with correlation-based successive projections algorithm (SPA)[J]. Appl Spectrosc, 2018, 72(5): 740-749. |
| 23 | JIANG H, XU W, CHEN Q. Comparison of algorithms for wavelength variables selection from near-infrared (NIR) spectra for quantitative monitoring of yeast (Saccharomyces cerevisiae) cultivations[J]. Spectrochim Acta A, 2019, 214: 366-371. |
| 24 | LI M, XIA L, WU Q, et al. MD-LDA: a supervised LDA topic model for identifying mechanism of disease in TCM[J]. Data Technol Appl, 2024, 59(1): 1-18. |
| 25 | ALMOUJAHED M B, RANGARAJAN A K, WHETTON R L, et al. Non-destructive detection of fusarium head blight in wheat kernels and flour using visible near-infrared and mid-infrared spectroscopy[J]. Chemom Intell Lab, 2024, 245: 105050. |
| 26 | SCHREUDER J, NIKNAFS S, WILLIAMS P, et al. Non-destructive prediction of fertility and sex in chicken eggs using the short wave near-infrared region[J]. Spectrochim Acta A, 2024, 322: 124716. |
| 27 | ZHANG X, SUN J, LI P, et al. Hyperspectral detection of salted sea cucumber adulteration using different spectral preprocessing techniques and SVM method[J]. LWT, 2021, 152: 112295. |
| 28 | MAO S, ZHOU J, HAO M, et al. BP neural network to predict shelf life of channel catfish fillets based on near infrared transmittance (NIT) spectroscopy[J]. Food Packaging Shelf, 2023, 35: 101025. |
| 29 | TAN B, YOU W, HUANG C, et al. An intelligent near-infrared diffuse reflectance spectroscopy scheme for the non-destructive testing of the sugar content in cherry tomato fruit[J]. Electronics, 2022, 11(21): 3504. |
| 30 | 刘婷婷. 基于近红外光谱的猕猴桃糖度分级及品种鉴别技术研究[D]. 西安: 西京学院, 2024. |
| LIU T T. Research on Kiwifruit agar classification and varitty classification technology based on near infrared spectroscopy[D]. Xi'an: Xijing University, 2024. | |
| 31 | 余展旺, 殷海, 何曼文, 等. 基于高光谱成像技术对菜心种子霉变的识别[J]. 种子, 2024, 43(8): 146-150, 156. |
| YU Z W, YIN H, HE M W, et al. Identification of cabbage seed mildew based on hyperspectral imaging technology[J]. Seeds, 2024, 43(8): 146-150, 156. |
| [1] | 刘金彦, 廖永娟. 季铵盐二聚表面活性剂C12-S2-C12·2Br复配体系在氯仿中形成反胶团的增溶水状态[J]. 应用化学, 2013, 30(07): 846-851. |
| [2] | 崔晓君, 袁昌明, 徐立恒. 花生油中过氧化物的近红外光谱分析[J]. 应用化学, 2008, 25(3): 375-377. |
| [3] | 高俊, 徐建强, 高桂枝, 徐永业, 陈苏敏. 近红外光谱测定聚四氢呋喃混合液[J]. 应用化学, 2008, 25(12): 1435-1438. |
| [4] | 孟庆繁, 候欣彤, 魏广英, 逯家辉, 郭伟良, 滕利荣. 近红外光谱无损定量分析吡嗪酰胺片[J]. 应用化学, 2007, 24(10): 1153-1156. |
| [5] | 高俊, 徐永业, 姚成. 近红外光谱法测定汽油中的烯烃含量[J]. 应用化学, 2005, 22(12): 1390-1392. |
| 阅读次数 | ||||||||||||||||||||||||||||||||||||||||||||||||||
|
全文 36
|
|
|||||||||||||||||||||||||||||||||||||||||||||||||
|
摘要 99
|
|
|||||||||||||||||||||||||||||||||||||||||||||||||